Huxelerate Platform

In only a few minutes, create a fully encrypted HPROF file from your MATLAB Simulink model to generate a Performance Analysis Report, containing information on current and achievable execution times, resource consumption, memory usage and timing constraints violations of your vehicle architecture software and receive optimization directives.

Your Code Is Safe With Us.

Safely analyze your source code on your private workstation or cloud infrastructure, receive performance reports directly integrated into your CI/CD pipeline, and collaborate in-cloud with your team members and suppliers to have a complete overview of your vehicle system performance.

This way, Huxelerate never gets access to your code.

From your code to the Performance Analysis Report
with three Huxelerate product components:
Huxelerate Utility
Huxelerate Code Analyzer
Huxelerate Platform
Export your code from MATLAB Simulink as input for the Huxelerate Utility to analyze code.

Analysis occurs locally on the user workstation together with datasets and libraries (common standards supported i.e. ARXML files)

Analyze your code with Huxelerate Code Analyzer and generate the performance report.

The analysis generates a non-reversable and fully encrypted HPROF file

Upload the HPROF file on the Huxelerate Platform.

Your source code never leaves your infrastructure and the Huxelerate Platform does no have access to it.

Obtain performance results and optimization directives to optimize your code.

Leverage the Huxelerate Platform to compare performance analysis on different architectures.

Performance Assessment and Optimization of a Single Function

function code performance assessment:

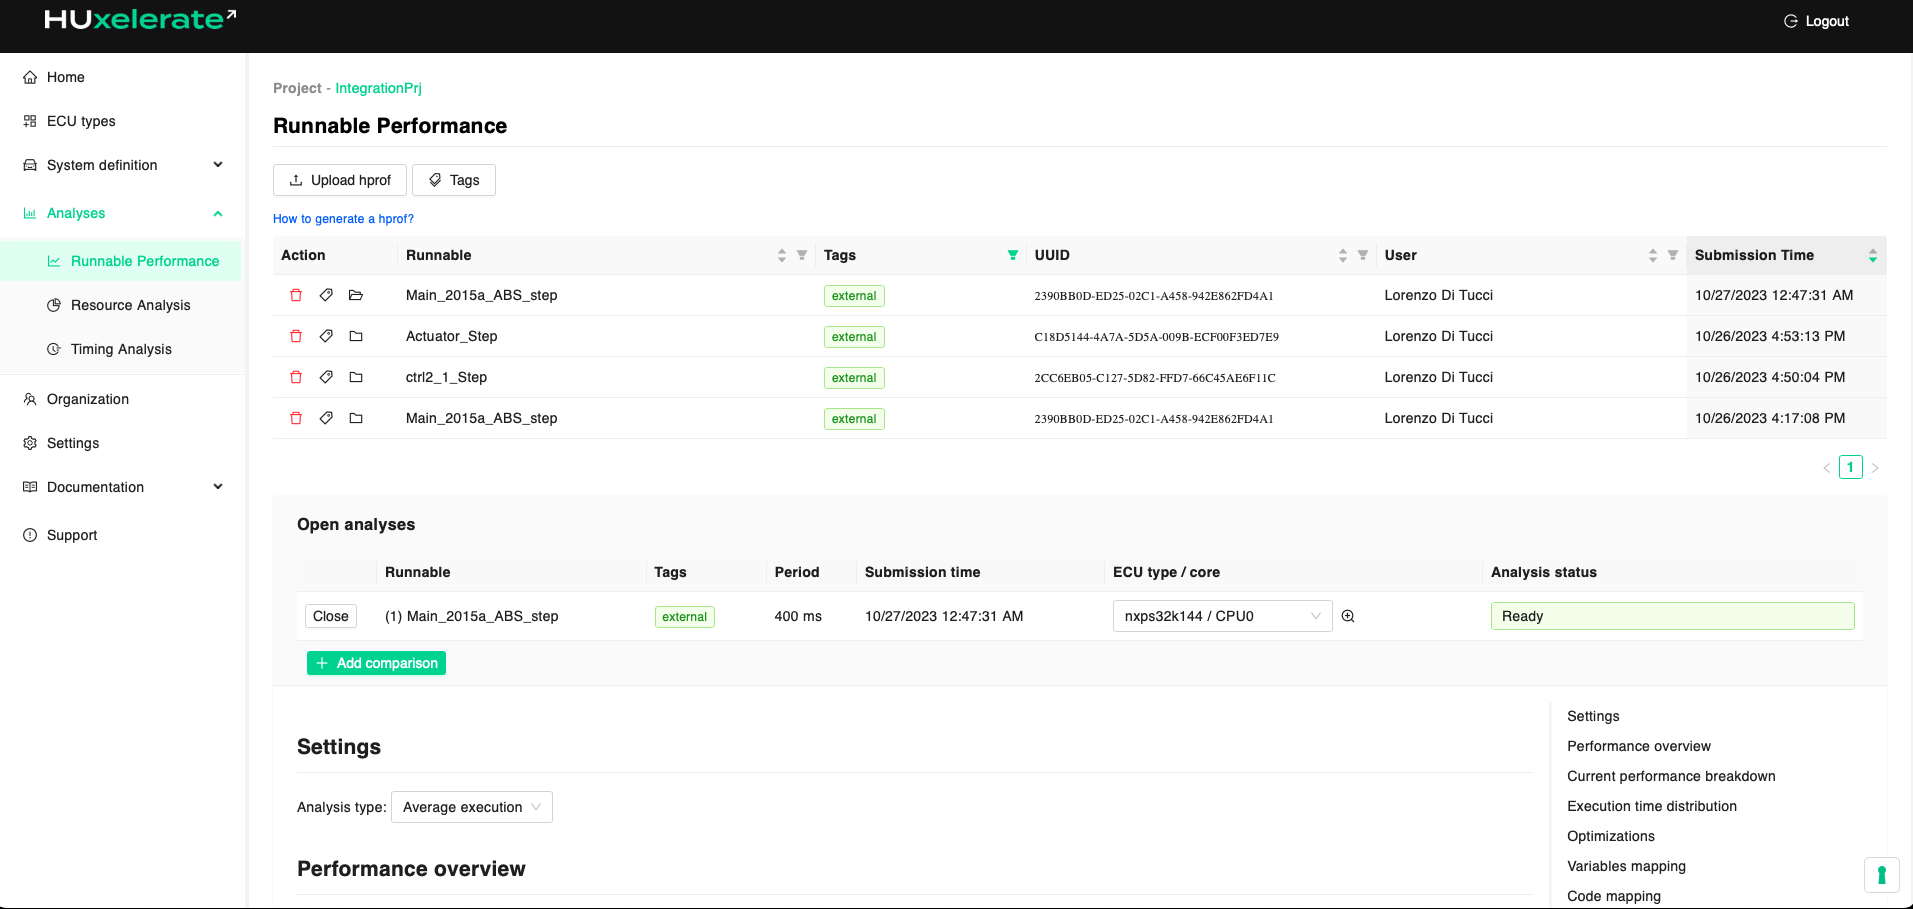
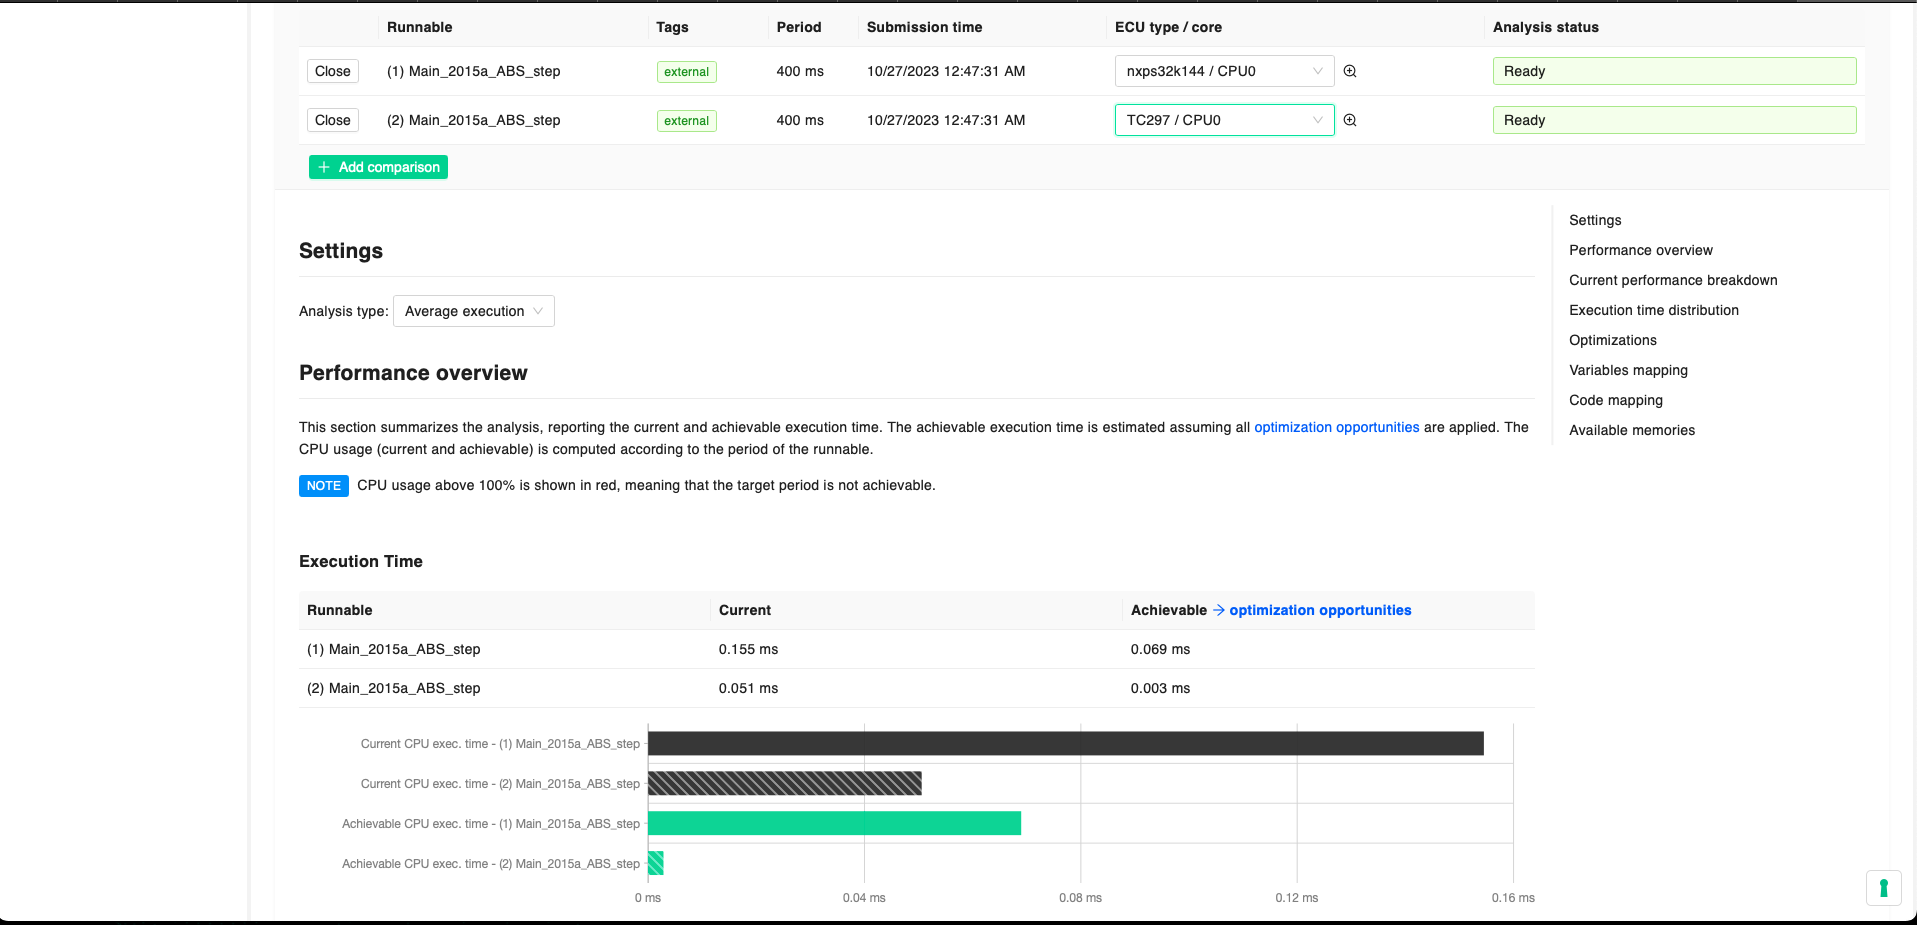
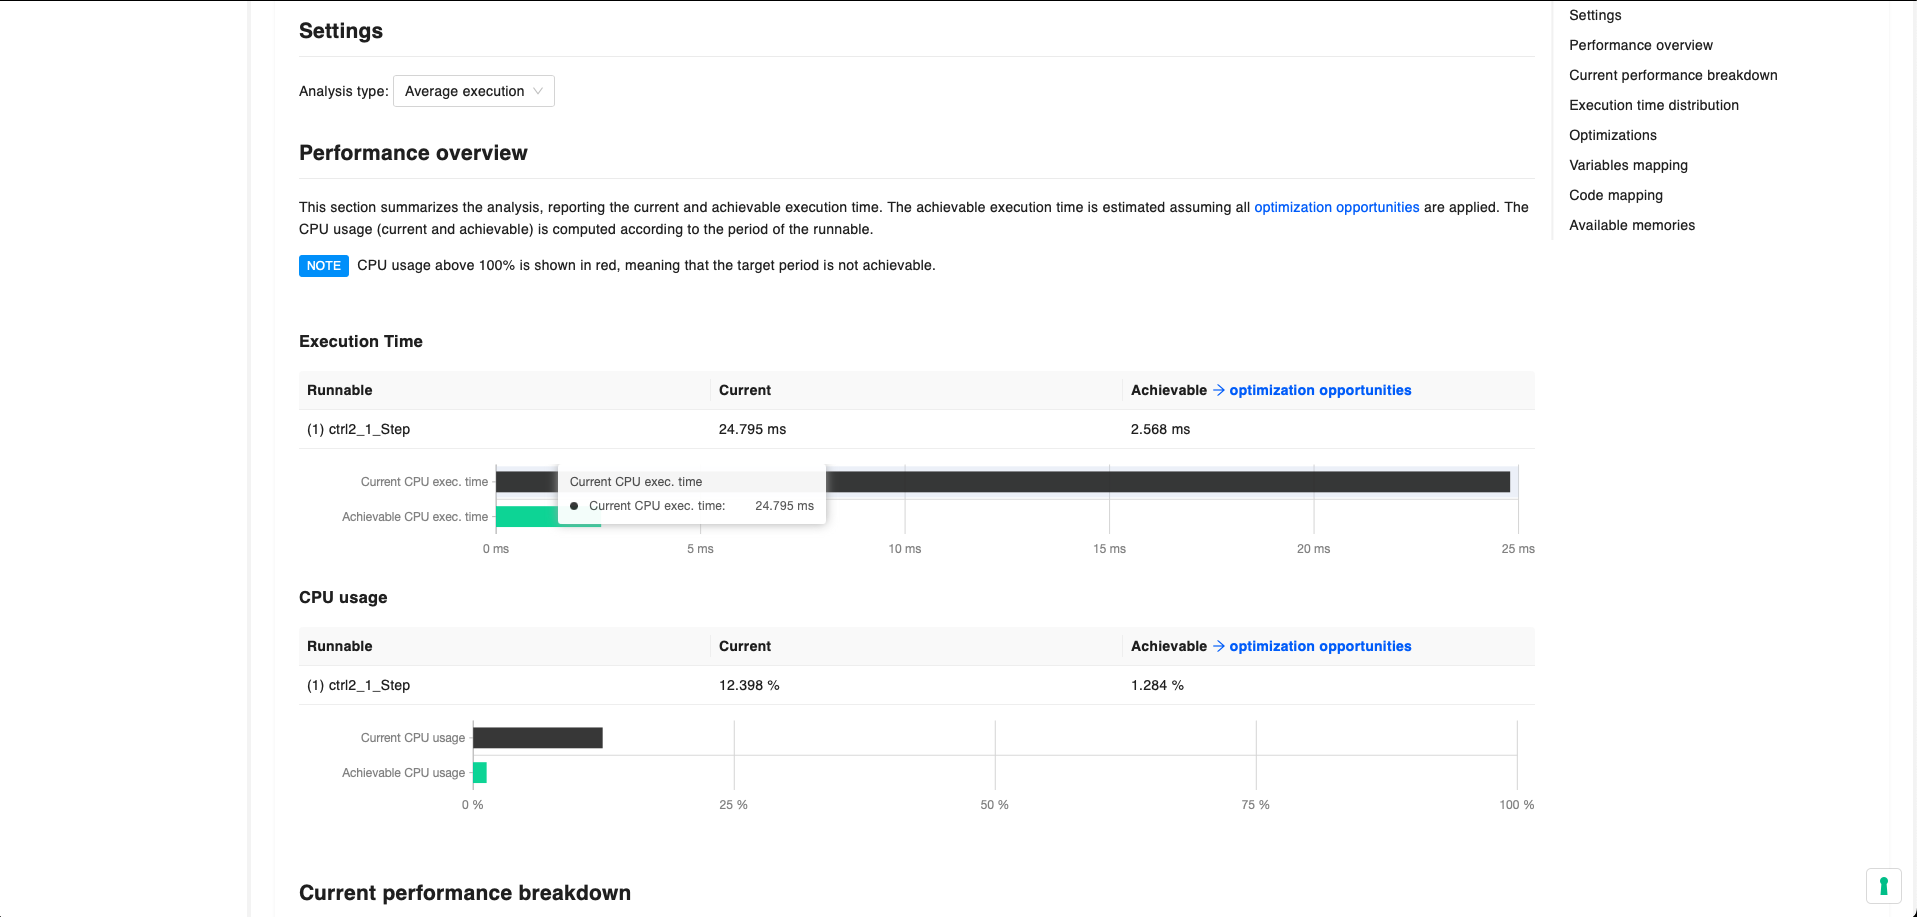
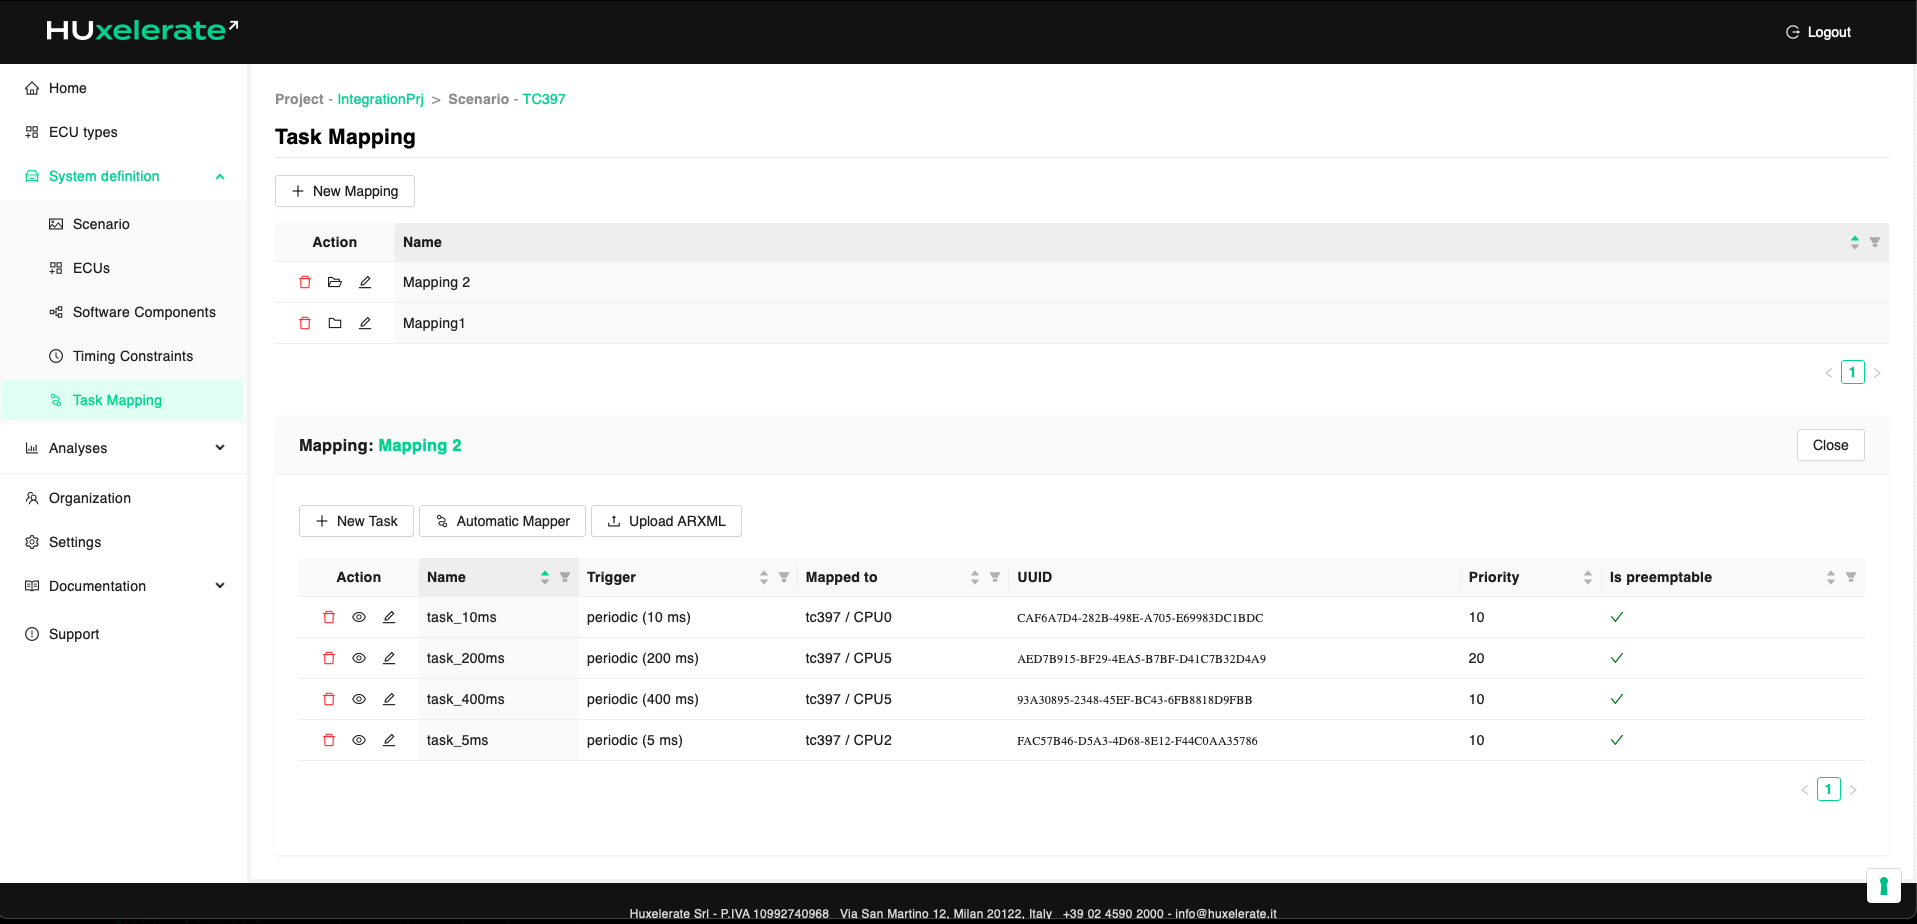
  • Assess the execution time of each software function on multiple target ECU processors.
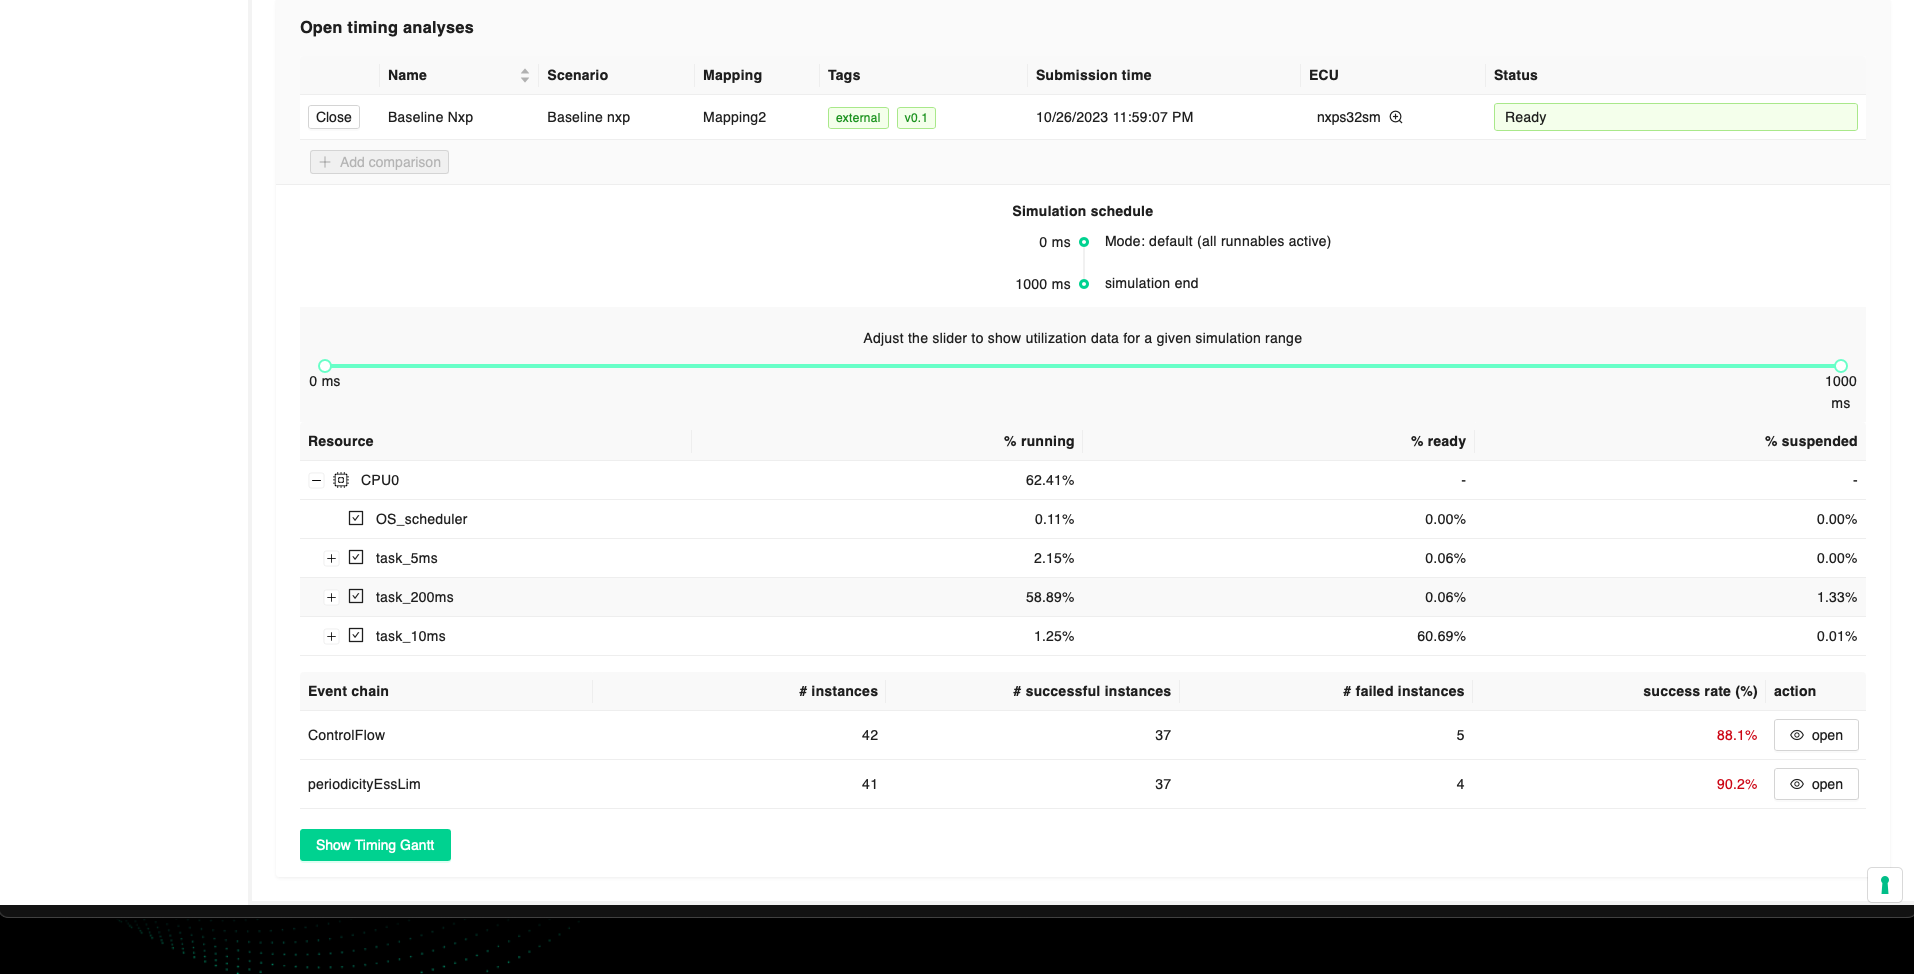
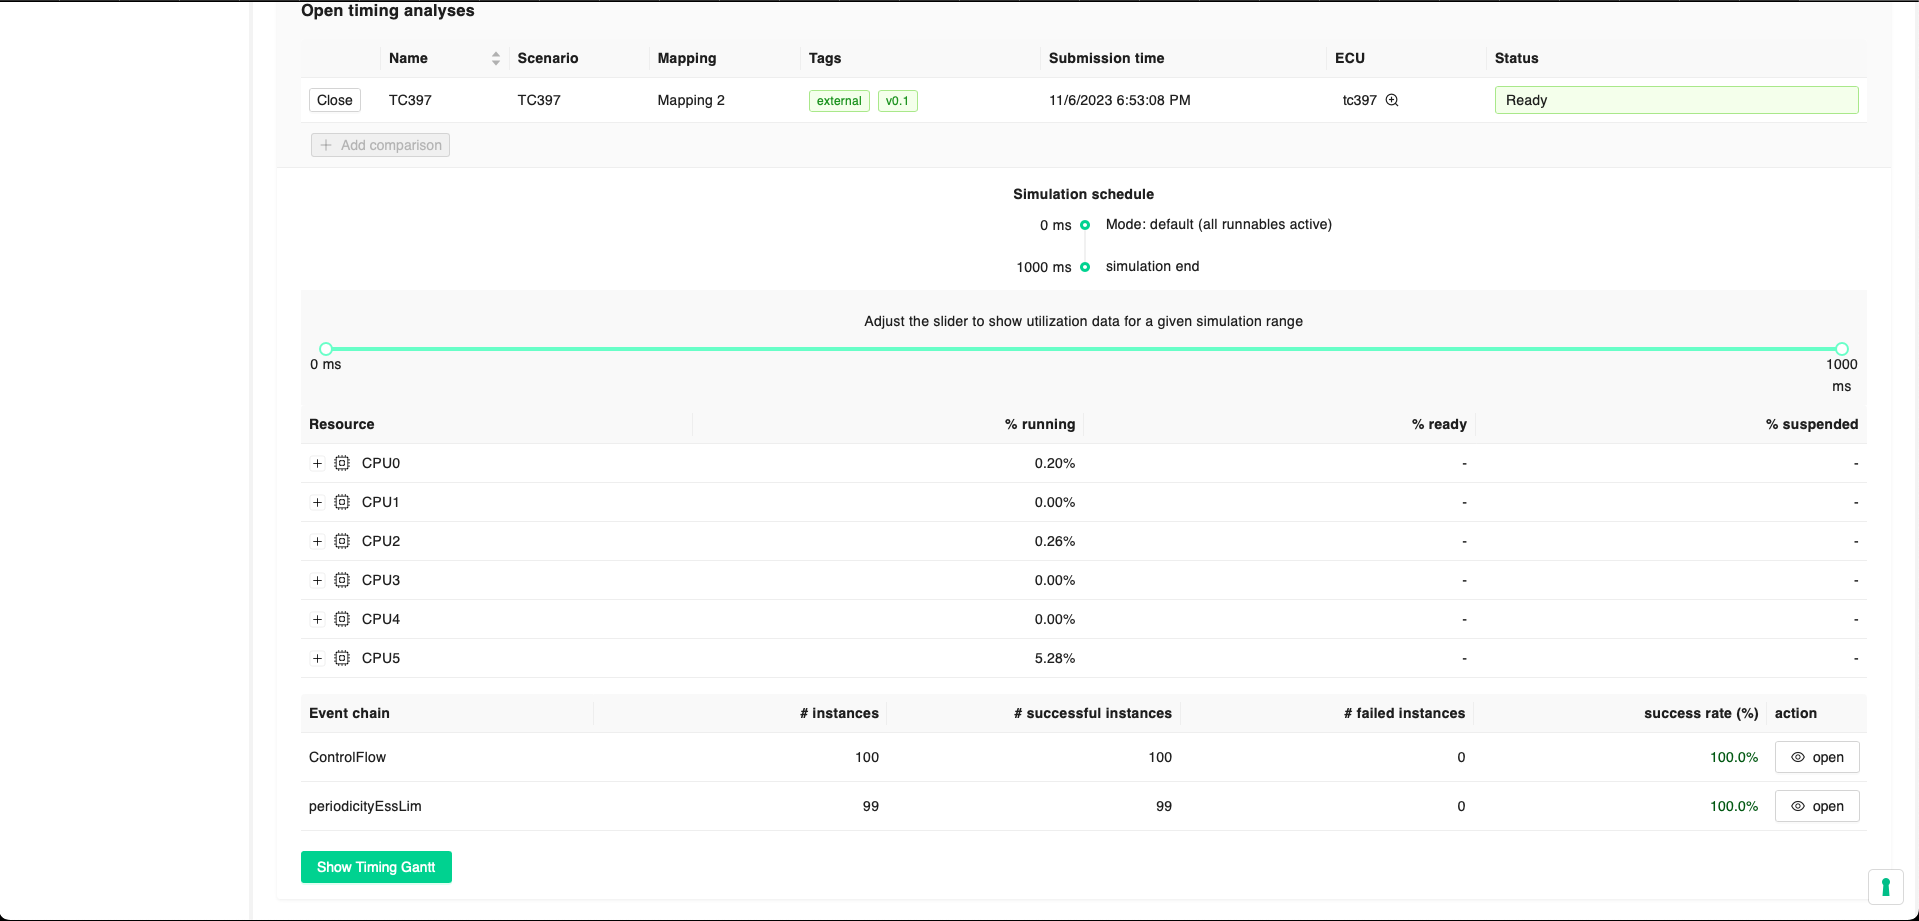
  • Assess the resource usage of each software function on its target ECU
Directives for optimization:
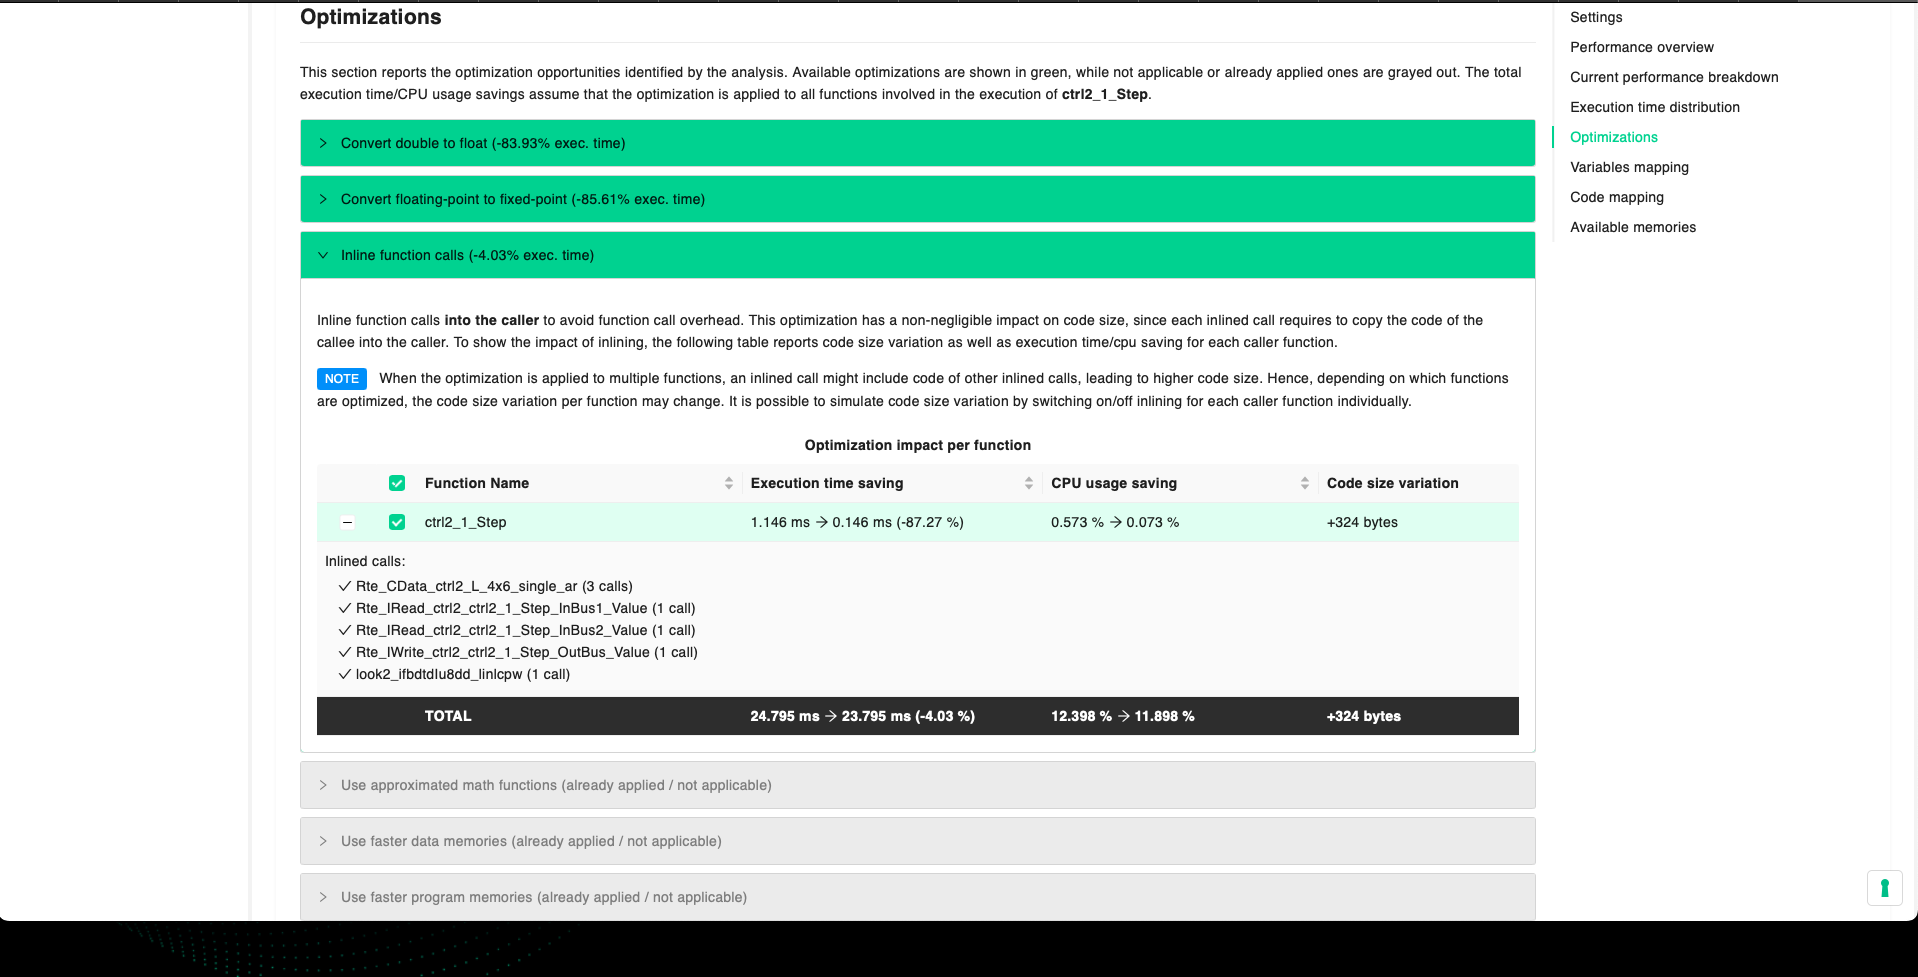
  • Receive software functions optimization directives in terms of execution time, resources, and memory usage to meet performance requirements.

Performance Assessment and Optimization of a Complete System

Multiple functions performance assessment:

  • Assess performance and resource usage of multiple functions on a single ECU processor or E/E architecture
  • Assess the impact of software function relocation within different ECUs of the E/E architecture
  • Assess software functions interactions and possible timing constraints violation.
Directives for optimization:
  • Receive software functions optimization directives to meet performance requirements at the entire system level.

ECU and E/E Architecture Assessment

Assess the impact of migrating all functions on a different target ECU or E/E architecture.

Integration of Third-party Software into an existing ECU/Multi-ECU System

Easily assess the impact of a new function into an existing ECU / Multi-ECU system.

A Closer Look at the Performance Analysis Report

Overview

The Performance Analysis Report provides information on:

  • Current and achievable performance in terms of execution time and CPU usage
  • Current performance breakdown for each invoked function
  • Execution time distribution (current and achievable) to spot performance outliers
  • Optimization opportunities to be implemented in MATLAB Simulink
  • Optimization impact per function in terms of total execution time and CPU usage savings
  • Variable mapping to memory
  • Code Mapping to memory
  • Comparison of current and achievable performance of different processors or E/E architectures

Scenario Analysis

The scenario analysis is based on a specific infrastructure target, as defined by the user in relation to the following variables:

  • ECU Target
  • Softwarte Components*
  • Timing Constraints
  • Task Mapping*

* Uploadable via common standards (i.e. ARXML file)

Timing Constraints are defined in terms of:

  • Expected order of executions of a set of runnables
  • min/max duration constraint on an event chain

Task mapping is specified by:

  • Set of tasks running on each ECU core
  • Priority level, periodicity, preemption possibility of tasks
  • Mapping of runnables onto tasks and ECU cores
  • Order of runnable execution in each task

Timing Analysis

The user can simulate the runtime behavior of the system by identifying:

  • Resources usage
  • OS schedular impact
  • Overhead/CPU load
  • Validation of timing constraints

The results of the simulation are represented on a Gantt Chart, allowing for:

  • Hierarchical Visualization of task scheduling and core occupancy
  • Analysis of interactions during simulation
  • Identification of possible issues: timing constraint violations, task preemptions, scheduler interaction and overhead, and task delays

Software Optimization

Automatically optimize the runnable mapping by elaborating an alternative proposal with relation to the current mapping. The optimization process focuses on minimizing:

  • Timing constraints violation intra ECU
  • ECUs CPU usage

The user can specify mapping constraints and re-run the mapping optimization process.

If mapping is not available, the optimizer can propose a new mapping based on the requirements of the user.